Wireless pressure transducer technology has changed industrial monitoring, with the global market reaching $3.1 billion in 2021 and projected to grow at 6.2% annually through 2030. These devices offer quick installation, with most models requiring just 5 minutes to set up. But maintenance remains a neglected aspect despite their importance in facilities where air compressors are vital factors. Devices receiving regular professional maintenance operate 30% more efficiently than those that skip it. We’ve compiled this complete guide to address common pre-sales questions and after-sales challenges with wireless pressure sensors, wireless pressure gages, and smart pressure sensor systems.
Pre-Sales Technical Specifications You Need to Know
Technical specifications matter when you select any wireless pressure sensor. Getting them wrong can get pricey. Each parameter affects performance, reliability and how well the sensor works with your existing systems.
Understanding Wireless Pressure Sensor Core Parameters
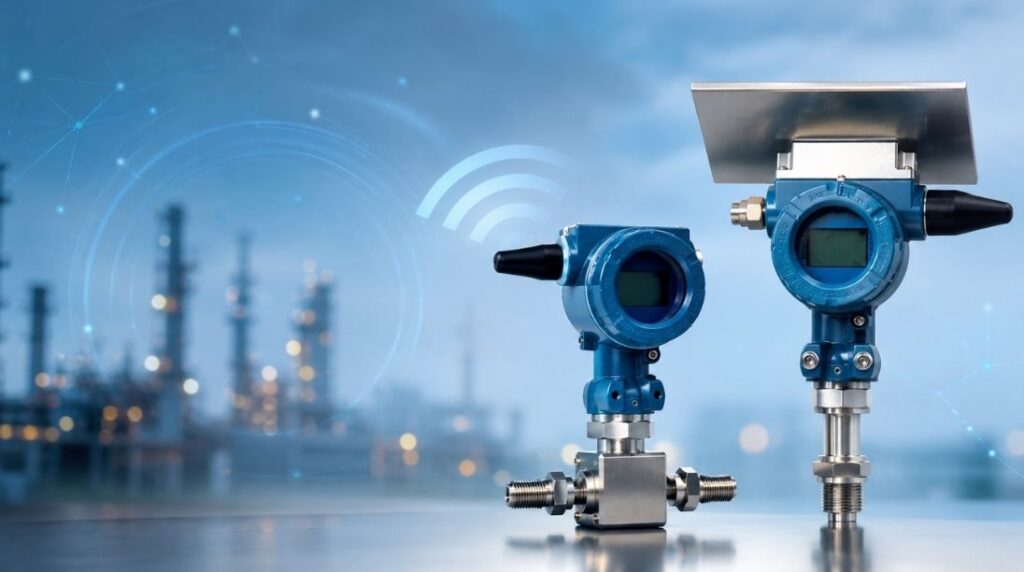
Three key components define how a wireless pressure transducer functions. The sensing element detects pressure changes and converts them into electrical signals using piezoelectric or capacitive technology. This core component deforms under pressure and creates an electrical signal that matches the pressure level.
The signal conditioning circuit amplifies the raw signal, filters noise and converts it to a standard output format ready for transmission. This processing ensures stability and accuracy before data moves to the wireless module. The wireless communication module encodes and transmits data to receivers through protocols like Bluetooth, LoRaWAN, 4G or WirelessHART. To name just one example, LoRa-based systems operate at 433MHz by default, with 868MHz and 915MHz options available.
Battery-powered sensors have become standard in modern wireless pressure devices and remove the need for power cabling. These systems provide steady power supply and higher energy output, with batteries lasting up to 10 years under optimal conditions.
Pressure Range and Accuracy Requirements
Most modern wireless pressure transducers handle pressure ranges from 29 PSI to 5,000 PSI. Some specialized models extend from 1 PSI to 300 PSI. High-temperature variants can measure pressures exceeding 10,000 PSI. The rated pressure range defines where the sensor operates with optimal performance and accuracy.
Accuracy specifications appear as a percentage of full scale (FS). Modern sensors achieve as low as ±1% Total Error Band (TEB). A sensor with 1% FS accuracy and a 100 PSI range can vary by ±1 PSI from actual pressure. High-precision models reach 0.25% accuracy with thermal drift of 0.1% at 38°C.
Accuracy covers non-linearity, hysteresis and non-repeatability. The 1% BFSL specification has all these factors. Selecting a sensor with inappropriate accuracy levels results in unreliable measurements, especially when you have applications that require precise control.
Operating Temperature and Environmental Ratings
Temperature specifications have two critical aspects. The operating temperature range defines temperatures at which the sensor functions without immediate failure, from -40°C to 85°C in most cases. The compensated temperature range represents the interval where the sensor’s output is fine-tuned to account for temperature-induced changes.
Battery performance degrades below -20°C and can cause complete failure in extreme cold. The difference between ambient and media temperature affects sensor selection. Media temperature specifications have wider ranges than operating temperature, as more material separates the temperature from sensitive electronics.
Industrial-grade models handle 50g shock and 8g vibration across temperatures from -30°C to 75°C. Temperature coefficient errors affect both zero offset and span, expressed as percentage of full scale per degree Celsius.
Housing Material and IP Protection Standards
Stainless steel and polymer housing protect most wireless pressure transducers. This durable design handles harsh environments while maintaining measurement accuracy. Models use 304 stainless steel housing combined with high-impact polycarbonate. The port design eliminates internal O-rings or organics exposed to pressure media and provides excellent durability and long-term performance.
IP (Ingress Protection) ratings determine the sensor’s resistance to environmental factors such as moisture, dust and debris. IP67 rating indicates total protection against dust and resistance to full immersion. IP65 and IP66 ratings suit applications with water splashes and dust exposure.
Safety certifications become critical in hazardous environments. ATEX/IECEx certifications apply to explosive atmospheres, while IS Class I, Division 1, Groups A-D ratings serve industrial settings. Wireless pressure transducers meet all applicable requirements for radio frequency communication and maintain CE and RoHS compliance. Proper grounding prevents electromagnetic coupling interference in complex working conditions.
Battery and Power System Issues
Power supply decisions affect the operational lifespan and reliability of wireless pressure sensor deployments. Two main battery configurations dominate the market. Each suits different application requirements.
Battery Type and Capacity: 38Ah vs 8000mAh Solar Options
Standard wireless pressure transducers offer three battery configurations. The 76Ah non-opening shell battery delivers 3.6V output with 300mA continuous discharge and 600mA peak current capability. The more common 38Ah non-opening shell battery maintains the same voltage and current specifications at 3.6V, 300mA continuous, and 600mA peak. The 8000mAh rechargeable battery provides 3.6V with much higher current capacity for solar applications: 1.5A continuous and 3A peak discharge.
The 2100 mAh battery capacity found in some compact LoRaWAN models is very different from industrial-grade options. Battery capacity affects deployment flexibility. Low-power designs consume less than 0.432W of power.
Battery Lifespan Calculation (10-Second Transmission Intervals)
Transmission frequency determines battery longevity. A 10-second upload interval yields around 9 months of operation based on 38Ah capacity with 10% degradation factored in. 1-minute intervals increase lifespan to 1-2 years. 5-minute intervals provide roughly 2 years of service. Ten-minute uploads extend operation to 2-3 years, 30-minute intervals reach around 3 years, and hourly transmissions achieve 3-4 years of battery life.
Standard five-year battery life assumes a 10-second update rate. Sensors that consume 100mA during 15-second transmission cycles with 15-minute intervals calculate to 1.67mA average draw. The average current drops to around 1.11mA when you reduce sensor on-time from 15 seconds to 10 seconds. This extends battery life by roughly 33%.
Solar Panel Charging Performance and Limitations
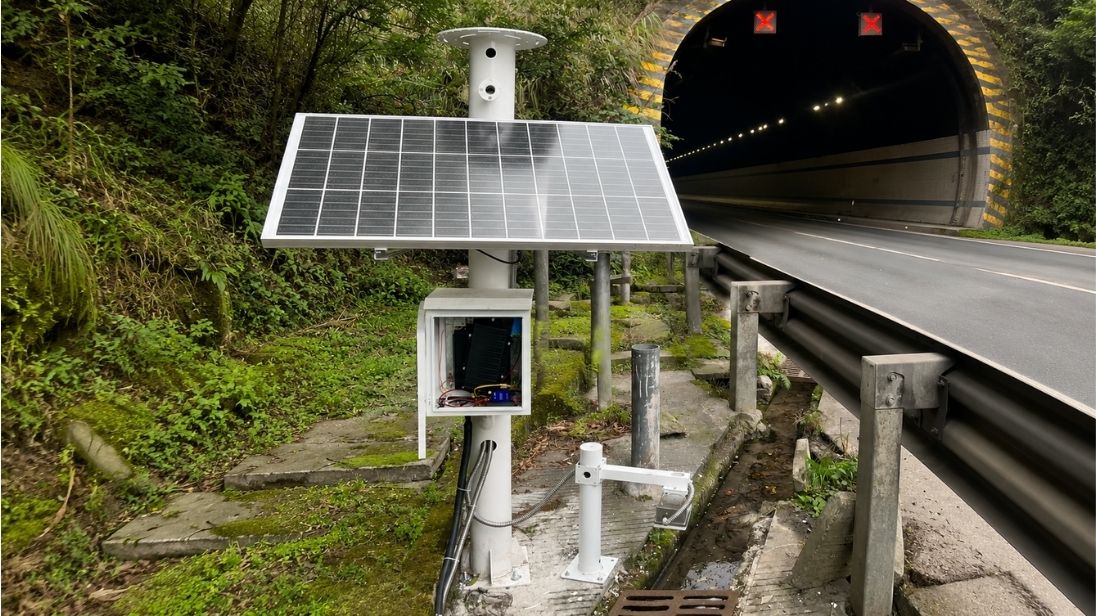
Solar-equipped wireless pressure gages convert sunlight into continuous power through photovoltaic cells. The 6V/320mA solar panel measures 104×140mm and requires around 2.5 days to fully charge an 8000mAh battery under peak current conditions. The system can nearly achieve energy self-sufficiency in regions with ample sunlight.
The 8000mAh battery supports 1-minute upload intervals for roughly half a month before depletion without solar exposure. This limitation requires careful site assessment before solar deployment. Solar panels support external power supply modes and offer two power supply configurations: external and rechargeable battery options.
When to Replace Battery: Voltage Thresholds
Battery voltage monitoring prevents unexpected communication failures. Replace batteries when voltage drops below 3.3V. Communication modules experience transmission failures below this threshold and prevent data uploads entirely. Lithium batteries maintain stable operation between -40°C and 125°C, though performance degrades below -20°C for wireless pressure transducer applications.
Battery lifespan varies from 5 to 12 years. This depends on usage environment, vehicle usage frequency (for mobile applications), and battery chemistry. High temperatures accelerate internal chemical reactions and cause rapid power consumption. Low temperatures reduce battery voltage temporarily.
Power Consumption Optimization Tips
Three strategies extend battery life. First, add a switch to control LCD screen operation and reduce power draw. The display already uses low-power design but still consumes energy. Second, extend upload intervals to prolong battery life since data transmission represents the main power drain. Third, adjust air speed rate to lower levels (LV3 or below) and decrease transmission power consumption, though this sacrifices communication distance. Transmission frequency optimization extends battery life. Sensors consume power with each wireless data transmission.
Communication and Transmission Problems
Transmission reliability separates functional wireless pressure sensor deployments from failed installations. LoRa-based systems dominate industrial applications, yet communication problems remain the biggest source of after-sales support requests.
LoRa Transmission Distance: Ground vs Specified Range
Manufacturers specify up to 5 kilometers transmission range for LoRa wireless pressure transducers, with some achieving 2-5 km in urban environments. The default transmission distance stands at 1.2 km in open environments. But ground performance is different. Field tests reveal signal loss at 200 meters in certain locations due to physical obstructions and electromagnetic interference.
Urban areas achieve 2-5 km range, while suburban zones reach up to 20 km. The 7 km straight-line range requires optimal antenna placement and minimal obstructions. Forests reduce transmission distance greatly, as do metal structures and dense building clusters. Installations beyond 1.2 km require network bridges and repeaters to extend coverage.
Three Critical Parameters That Must Match for Reliable Connection
Connection failures occur when three parameters don’t match between sensor and gateway. Network channel defines the communication frequency band and defaults to 433MHz with ranges of 410-441MHz, 470-510MHz, or 850-950MHz across channels 0-31. Network identifier serves as the LoRa network number and ranges from 0 to 65,535. Air speed rate determines communication bandwidth, with levels LV1 through LV6 representing 0.3 to 5.5 Kbps.
All three parameters must match to communicate successfully. Higher air speed rates increase transmission speed but reduce distance. Ranges exceeding 200 meters need air speed rate adjusted to LV3 or lower. Lower numerical levels provide greater transmission power and distance but increase power consumption.
Maximum Sleep Time Settings and Data Loss Prevention
Default sleep time settings reach 3600 seconds (1 hour). Extending sleep intervals reduces power drain during gateway-transmitter communication interruptions, as the sensor stops searching for network connections. Longer sleep periods prevent battery depletion from repeated connection attempts but delay data transmission recovery after connection restoration.
Cloud Upload Methods and Platform Integration
Three methods enable cloud data transmission. Direct 4G SIM card transmission connects without intermediate hardware. PC-based systems use MQTT protocol to read and upload data through custom software. External DTU devices employ Modbus protocol to extract RTU data for cloud platforms. Platform selection depends on existing infrastructure and data security requirements, especially with AES 128 encryption for Bluetooth Low Energy transmissions.
Timestamp Synchronization Issues and Fixes
Wireless pressure gages embed timestamps when uploading measurements. The server returns its time to the sensor and overwrites the instrument’s internal clock to calibrate it. Time synchronization prevents erroneous data correlation, which causes service failures in distributed sensor networks. Clock drift between sensors creates misalignment, especially critical for multi-sensor installations requiring coordinated measurements.
Configuration and Setup Challenges
Configuration errors account for the majority of original deployment failures with wireless pressure sensor systems. Three setup procedures require precise execution to establish reliable sensor-to-gateway communication.
Connecting Smart Pressure Sensor to Gateway: Required Conditions
Three parameters must line up between your smart pressure sensor and gateway. Network channel, network identifier, and air speed rate function as authentication credentials. Mismatched settings prevent communication. Set network channel values between 0-31, network identifier from 0-65,535, and air speed rate from LV1-LV6. Power cycle both gateway and sensor after configuration to establish the connection.
Zero Point Reset Using Button Method
You can execute zero reset through button sequence rather than magnetic tools. Press W1 key repeatedly until “95” appears in the upper left corner of the display. Press W2, then press ZERO key. Wait for the backlight to extinguish. This confirms successful reset. The magnet tool restarts the sensor head but does not perform zero calibration.
Zero Point Migration and Deviation Correction Procedures
Wireless pressure transducers output in a linear fashion. When specific pressure points show deviation, you can correct the error by performing zero reset under no-load conditions. Zero migration addresses installation scenarios where pressure tapping points differ in elevation from the sensor location. Positive migration occurs when sensors install below tapping points. Negative migration applies to installations above reference points. Migration adjustments shift the 4mA output signal to correspond with actual zero pressure conditions.
Sensor Data Collection vs Upload Timing
Data collection timing equals screen refresh intervals. Upload timing follows RTU configuration settings. These operate independently and allow collection rates faster than transmission frequencies.
Reading Gateway Device ID: Step-by-Step Method
Two approaches retrieve gateway device IDs. Method one reads register addresses through custom firmware functions. Method two uses maintenance software in read-only mode. Configure SET1 and SET2 values on the sensor to match gateway parameters. Restart both devices, then launch maintenance software to display parameters. Never modify settings through maintenance software. This erases factory calibration.
Common After-Sales Problems and Troubleshooting
After-sales support requests concentrate around six recurring problems. Understanding why it happens accelerates resolution and minimizes downtime.
Signal Loss and Connection Failures
Sensor compatibility verification prevents most connection failures. Generators, sensors, and gateways must operate on similar frequency bands (900 MHz, 868 MHz, or 433 MHz). Distance between transmitter and central monitoring systems requires verification, as buildings with concrete block walls limit range to 100 feet, while open areas achieve 1000 feet. Environmental placement matters. Position gateways away from metal surfaces, concrete barriers, and high-voltage AC conduits. Check sensors for physical damage, liquid ingress, and corrosion affecting antenna connections. Place sensors 10-15 feet from gateways during testing to eliminate environmental variables.
Inaccurate Readings and Calibration Drift
Temperature changes cause progressive signal deviation without corresponding pressure changes. Thermal cycling near exterior walls or outdoor mechanical spaces shifts differential pressure reference points over seasons. Contamination alters pressure transfer before sensor failure occurs. Dust accumulation, oil aerosols, and biological growth obstruct sensing ports. Vibration in mining or drilling environments accelerates mechanical fatigue and causes permanent deformation. Electromagnetic interference from motors, relays, and wireless systems distorts signals when grounding or shielding fails.
Battery Draining Faster Than Expected
Low temperature environments represent the most common drain cause. Standard alkaline batteries fail faster in freezers and require lithium iron disulfide batteries below 0°C. Poor signal quality forces sensors to transmit at high power and increases consumption. Cross-test batteries between sensors to identify hardware defects versus battery quality issues. Signal strength weaker than -90dBm indicates placement optimization needs.
Gateway Communication Errors
Gateway check-in confirmation precedes sensor troubleshooting. Press gateway utility button right after powering sensors to download sensor IDs from software networks. Power sensors off for 60 seconds minimum before restart. Reset sensors to default settings through online portals before manual gateway button presses. Networks configured on the system prevent normal sensor communication.
Environmental Interference Solutions
Electrical issues account for many transducer failures and include incorrect polarity, loose terminals, and short circuits. Shield twisted pair cables and ground shields at one end only. Maintain proper cable strain relief and moisture protection. Overpressure spikes and pressure pulsation cause permanent diaphragm damage. Dampeners and vibration isolation mounts in pumping applications prevent cavitation and mechanical seal damage. Corrosive media, high humidity, and extreme temperature cycling accelerate failure when ingress protection proves inadequate.
Wireless Pressure Gages Maintenance Checklist
Perform visual inspections monthly with semiannual recalibration schedules. Harsh environments require shortened intervals and protective add-ons like isolators or snubbers. Verify housing integrity for cracks, rust, or deformation. Confirm dial scale legibility and range matching. Clean internal dust after removing movement components. Inspect gears, levers, and springs for wear and corrosion. Test pointer smoothness and zero-return capability. Check Bourdon tubes for cracks and leaks. Fine-tune using reference gages 1-2 grades higher in accuracy at 20±5°C ambient temperature. Document model, range, accuracy class, inspection dates, and parts replaced. Professional maintenance increases operational efficiency by 30%.
Conclusion
We’ve covered the technical specifications, power management strategies and communication protocols that define successful wireless pressure transducer deployments. You’ll learn about the three-parameter match requirement and how to calculate battery lifespan based on transmission intervals. These details solve the problems you’ll encounter most often.
Proper configuration and regular maintenance prevent 90% of after-sales issues. The troubleshooting procedures outlined here will help you solve problems without pricey downtime or factory returns. Zero point calibration and signal optimization techniques work particularly well.
You can now select and deploy wireless pressure sensors that deliver reliable performance throughout their operational lifetime with confidence.